WebSocket 协议

最近有个项目要做一个Slack Robot, 就是根据用户发到Slack 某个Channel的内容, 给出智能回复.

与Slack的交互方式有2种: HTTP连接的方式和WebSocket的方式. HTTP 连接的方式又有2种实现方式:

  1. 我们提供一个公开的endpoint, 当Slack的Channel 有消息的时候, Slack 以webhook的方式及时通知我们, 我们的app 给出回复.
  2. 我们不提供endpoint, 我们连接Slack的endpoint, 以固定时间间隔的方式去poll 消息, 如果有新消息, 我们的app 给出回复.

以上这2种方式都不是很好的方式, 对于第一种, 我们要提供一个公开的endpoint, 在我们的生产环境基本不可能, 对于第二种方式, 不是基于事件的, 不管有没有消息, 都要固定的去poll, 对于一个app 里面有多个实例的情况, 还要控制那个实例去poll.

所以 WebSocket 的方式是最好的, 不过当时就有开发人员提出了意见: 我们的生产环境时不能连外网的, 要连只能通过http 代理, 而我们的生产环境的代理只支持 http 代理, 不支持sock 方式, 所以这种 WebSocket 行不通. 是真的吗?

在我们看看 WebSocket 到底是什么之前, 先做一个 WebSocket 的例子: 使用Node.js 开一个WebSocket 服务, 然后在浏览器开一个 WebSocket 客户端.

WebSocket 服务端

  1. 新建一个文件夹

    mkdir wsServer
    cd wsServer
  2. 新建一个 package.json

    vim package.json

    输入如下代码

    {
     "name": "wsServer",
     "version": "0.0.1",
     "type": "module",
     "dependencies": {
       "ws":"8.8.1"
     }
    }
  3. 新建一个服务端代码文件

    vim server.js

    输入如下代码:

    var WebSocketServer = require('ws').Server
    var fs = require('fs')
    
    const wss = new WebSocketServer({ port: 8080 });
    
    wss.on('connection', function connection(ws) {
     ws.on('message', function message(data) {
     console.log('received: %s', data);
     ws.send(data + " -> server ack");
     });
    
     fs.watch('/tmp/', (eventType, fileName) => {
     console.log('Get event on file ' + fileName + ', type: ' + eventType);
     ws.send('file -> ' + fileName + ' -> ' + eventType);
     })
    
     ws.send('welcome to WebSocket world!');
    });

    上面这段代码做3件事情:

  4. 启动 WebSocket 服务器在8080 端口上, 当有人来连接的时候, 发送欢迎消息;
  5. 当收到客户端消息的时候, 打印收到的消息, 并且发送给客户端 ack 消息;
  6. 监听本地 /tmp 文件夹的文件变动事件, 打印日志, 并推送给客户端;

启动服务端代码:

node server.js

WebSocket 客户端

在 Chrome 浏览器打开任意页面的控制台, 输入如下JavaScript 代码

const ws = new WebSocket('ws://10.249.64.103:8080');

// Listen for messages
ws.addEventListener('message', (event) => {
    console.log('Message from server: ', event.data);
});

document.addEventListener('click', (event) => {
    console.log("just clicked");
    ws.send('click on (' + event.x + ', ' + event.y + ')');
});

上面的代码做下面的事情:

  1. 连接服务端 WebSocket;
  2. 然后当收到服务器端消息的时候, 打印收到的消息;
  3. 当页面上收到点击事件的时候, 推送给服务端点击事件的坐标;

运行效果

客户端效果:
client.png

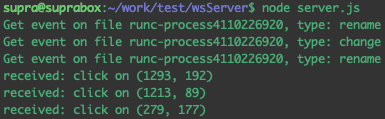
服务器端效果:
server.png

使用代理

因为客户端使用的是浏览器, 可以设置在chrome 设置对于这个IP 启用代理, 使用http 代理, 依然能联通server 端, 正常运转.

使用curl

使用curl 只能被动的接受服务器传来的消息, 不能发送任何消息. (这个 Sec-WebSocket-Key 是从浏览器刚才发送的历史中复制过来的)

curl \
    --include \
    --no-buffer \
    --header "Connection: Upgrade" \
    --header "Upgrade: websocket" \
    --header "Host: 10.249.64.103:8080" \
    --header "Origin: http://10.249.64.103:8080" \
    --header "Sec-WebSocket-Key: 1TFTcjPQ7iG2XvsZ83WgZg==" \
    --header "Sec-WebSocket-Version: 13" \
    http://10.249.64.103:8080

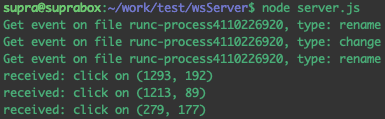
效果(curl 对回应消息只能拼接, 不换行):
server.png

JavaScript WebSocket API 文档

官方文档在这里: https://developer.mozilla.org/en-US/docs/Web/API/WebSocket/WebSocket
这个 WebSocket 类很简单:

  1. 构造函数给出服务器的地址, 包括ws协议, host 加 port;
  2. 有几个字段: 比如 url, readyState, protocol, bufferedAcmount, binaryType等, 有些是只读的;
  3. 客户端只有发送 send() 和 close() 方法;
  4. event handler:

    1. message: 当收到消息时;
    2. open: 当连接建立时;
    3. error: 当发送错误时;
    4. close: 当关闭连接时;

Node.js 的 WebSocket 实现库 ws 的文档

官方文档: https://www.npmjs.com/package/ws#sending-and-receiving-text-data
它不仅仅包含一个server端的API实现, 还包含一个做为 Node.js 客户端端代码实现

WebSocket 协议

官方文档: https://www.rfc-editor.org/rfc/rfc6455
当我们看过上面的 WebSocket 的例子之后, 再来看这个RFC 文档, 就不是那么难了.

为什么需要 WebSocket 协议

在 web 通信等某些场景下, 如果服务端发生了某些事件, 需要实时推送给客户端. 在传统的基于web的技术下, 需要客户端不断的去poll消息, 不管服务端到底有没有事件更新, 每次poll 都需要客户端发送一个http request, 并且如果发送的频率过低, 可能不能及时收到服务端事件更新, 如果频率过高, 又会对网络和服务端造成一些压力.

所以, 如果建立一个连接的情况下, 服务端事件变更主动推送客户端, 客户端只要等待就好了, 就完美解决了这个问题, 于是就有了 WebSocket 协议.

WebSocket 基本介绍

  1. 它可以使客户端和服务端在一个连接里面双向不间断通信;
  2. 通信过程分2阶段, 先是使用http协议握手连接, 然后以数据帧的方式双向发送数据;
  3. 广泛使用在游戏, 股票等需要实时消息通讯等软件中;
  4. WebSocket 可以使用现有web的 proxy和认证等成熟的机制;
  5. 通常开在80或443, 可以通过防火墙;

通常的 连接握手协议:

The handshake from the client looks as follows:

        GET /chat HTTP/1.1
        Host: server.example.com
        Upgrade: websocket
        Connection: Upgrade
        Sec-WebSocket-Key: dGhlIHNhbXBsZSBub25jZQ==
        Origin: http://example.com
        Sec-WebSocket-Protocol: chat, superchat
        Sec-WebSocket-Version: 13

   The handshake from the server looks as follows:

        HTTP/1.1 101 Switching Protocols
        Upgrade: websocket
        Connection: Upgrade
        Sec-WebSocket-Accept: s3pPLMBiTxaQ9kYGzzhZRbK+xOo=
        Sec-WebSocket-Protocol: chat
xxx Is Damaged and Can’t Be Opened. You Should Move It To The Trash

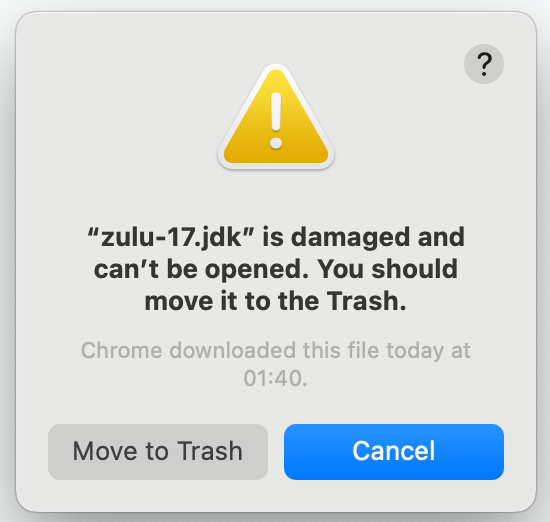
最近拿到公司 ARM 芯片的 Mac Pro, 一番设置, 可是新新下载的软件, 比如JDK, 总是报下面的错, 无法运行:
“xxx Is Damaged and Can’t Be Opened. You Should Move It To The Trash“
damage.png

如何修复

google 到这个修复方法: https://discussions.apple.com/thread/253714860

$ xattr -c <path/to/application.app>

使用上面的方法对 java 做上述操作, 还是一样的错误, 一度怀疑这个不行. 但是通过 xattr 查询它的属性, 发现又是相关. 最终发现这么解决: 对目录里面每层文件都做这个操作:

eric@Q67J490MY0 bin % pwd
/Users/eric/work/tools/jdks/jdk17.0.3.1/bin
eric@Q67J490MY0 bin % xattr -c *
eric@Q67J490MY0 bin % cd ..
eric@Q67J490MY0 jdk17.0.3.1 % xattr -c *
eric@Q67J490MY0 jdk17.0.3.1 % ./bin/java

上面的操作是对每个文件都去掉xattr的那些属性.

更多

xattr -h #查看帮助

python 使用 cProfile 做 profiling

最近开始看机器学习的项目, 于是开始看 Python 的代码. 把一个机器学习的模型发布上 prod 去预测结果, 发现生产环境里面 的性能很差: 本地 1s 能跑完的 API, 在生产环境需要 30 多毫秒. 先是看了下基本情况, 发现生产环境在预测那段代码, 竟然起了 50 多个 Python 线程. 于是怀疑生产环境因为使用 container, 但是却拿到了宿主机的 CPU 数量, 于是开了很多线程. 但是 container 却限制了 cpu 的使用量, 导致多线程竞争, 最终性能下降.

于是尝试做 profiling: cProfile 是python 自带的.

要做 profiling 的部分:

import os
import time
import cProfile
from transformers import BertTokenizer, BertModel

pretrained_model_path = os.path.abspath(os.path.dirname(__file__)) + '/bert-base-uncased'
bert_tokenizer = BertTokenizer.from_pretrained(pretrained_model_path, cache_dir='/tmp')
bert_model = BertModel.from_pretrained(pretrained_model_path)

s = "This brings us to the downsides"

def bert_function():
    t0 = time.time()
    for i in range(0, 10):
        inputs = bert_tokenizer(s, return_tensors="pt")
        outputs = bert_model(**inputs)

    print("used: {}".format((time.time() - t0)))

cProfile.run('bert_function()', 'my.prof')

执行

python test.py

使用 flameprof 转成 火焰图

python -m flameprof my.prof > my.svg

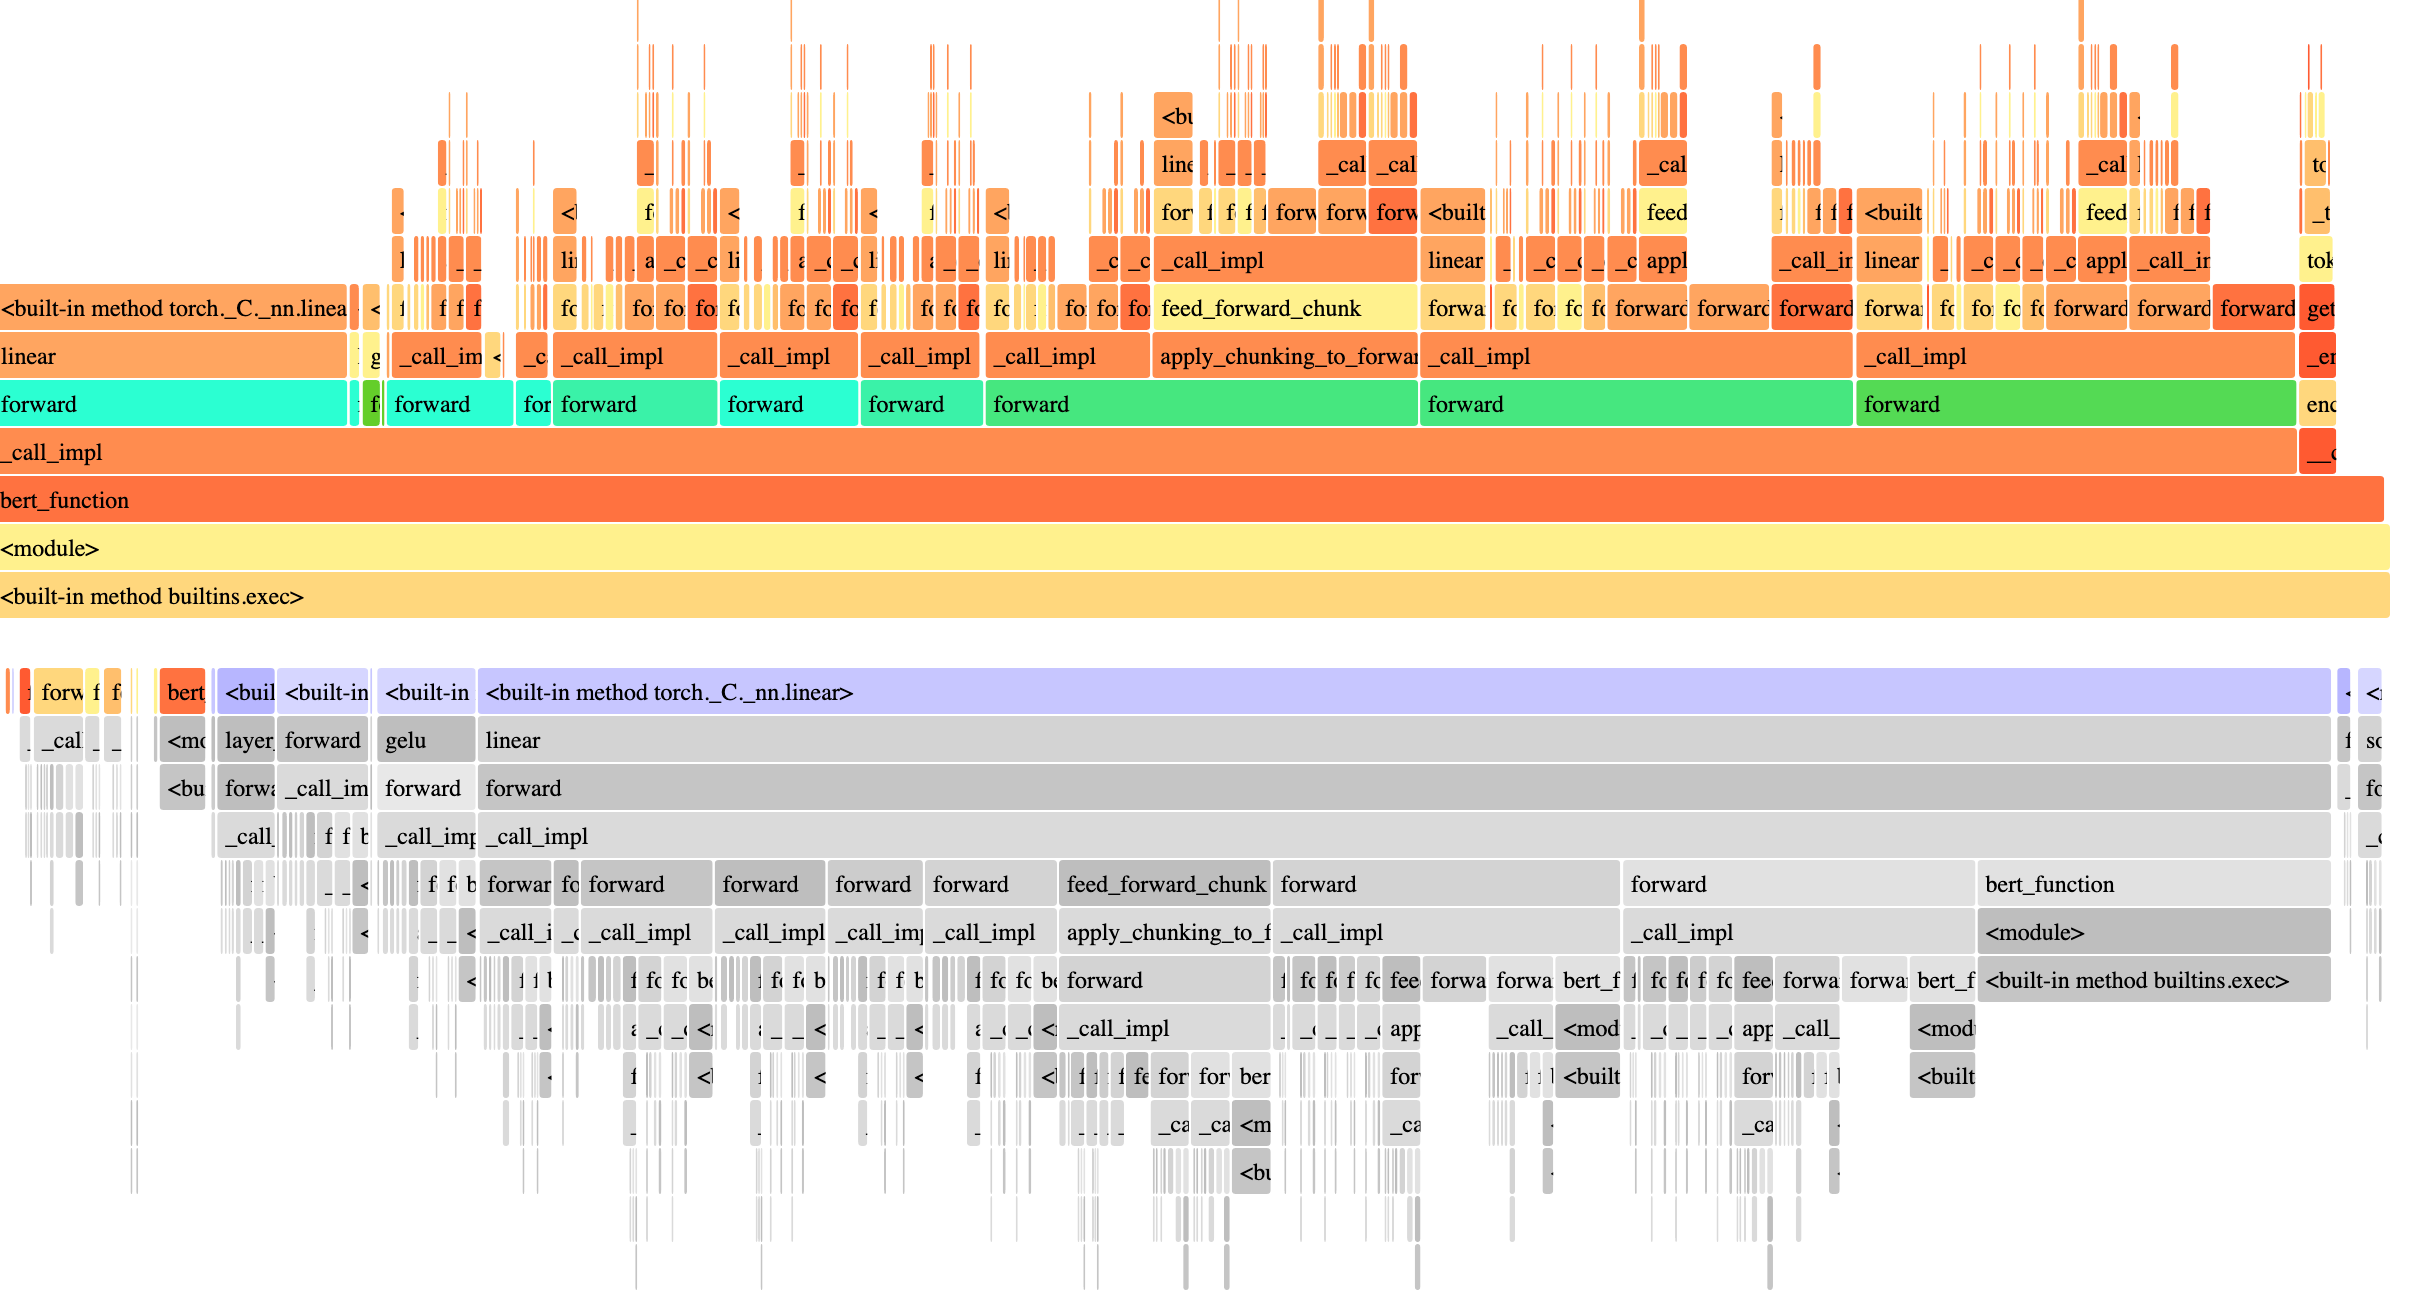
结果:
out_svg.png

参考:
https://docs.python.org/3/library/profile.html

Prometheus 学习笔记

Introduction

Overview

  1. Prometheus is an open-source systems monitoring and alerting toolkit.
  2. Prometheus collects and stores its metrics as time series data, i.e. metrics information is stored with the timestamp at which it was recorded, alongside optional key-value pairs called labels.
  3. Features

    1. a multi-dimensional data model with time series data identified by metric name and key/value pairs
    2. PromQL, a flexible query language to leverage this dimensionality
    3. no reliance on distributed storage; single server nodes are autonomous
    4. time series collection happens via a pull model over HTTP
    5. pushing time series is supported via an intermediary gateway
    6. targets are discovered via service discovery or static configuration
    7. multiple modes of graphing and dashboarding support
  4. Components

    1. the main Prometheus server which scrapes and stores time series data
    2. client libraries for instrumenting application code
    3. a push gateway for supporting short-lived jobs
    4. special-purpose exporters for services like HAProxy, StatsD, Graphite, etc.
    5. an alertmanager to handle alerts
    6. various support tools
  5. Prometheus configuration file: prometheus.yml

    1. global.scrape_interval
    2. global.evaluation_interval
    3. rule_files: []
    4. scrape_configs: {job_name:"", static_configs:""}
  6. Prometheus server UI

    1. status page: http://:9090/
    2. self metrics page: http://:9090/metrics
    3. expression browser: http://:9090/graph
  7. glossary

    1. The Alertmanager takes in alerts, aggregates them into groups, de-duplicates, applies silences, throttles, and then sends out notifications to email, Pagerduty, Slack etc.

Concepts

  1. Data models

    1. <metric_name>{<label_name>=<label_value>, ...}
    2. metrics_name 符合: /a-zA-Z_:*/ 字母数字下划线分号(分号只是用在定义 recording rule 的)
    3. dimensional(维度)需要通过 labels 定义
    4. time series: streams of timestamped values belonging to the same metric and the same set of labeled dimensions.
    5. 添加/去除等改变 label value 的操作会导致创建新的 time series
    6. label name 符合 /a-zA-Z_*/ 字母数字下划线 (2个连续下划线(__)开头的 label name 是系统保留用的)
    7. label value 可以使用任何 Unicode 字符
    8. A label with an empty label value is considered equivalent to a label that does not exist
  2. Metrics Types

    1. Counter: 单调增长的计数器, 重启后变为0再自增
    2. Gauge: 可增可减的数值
    3. Histogram: 柱状图 指标 basename
    1. _bucket{le=""}
    2. _sum: total sum
    3. _count: =_bucket{le="+Inf"}

      1. Summary
  3. Jobs & Instances

    1. When Prometheus scrapes a target, it attaches some labels automatically to the scraped time series which serve to identify the scraped target: job: <job_name> & instance: :

    Prometheus

  4. Configuration

    1. command-line flags configure immutable system parameters (such as storage locations, amount of data to keep on disk and in memory, etc.)
    2. configuration file defines everything related to scraping jobs and their instances, as well as which rule files to load.
    3. Prometheus can reload its configuration at runtime.
    1. send SIGHUP;
    2. HTTP POST request to the /-/reload endpoint

      1. scrape_config
    3. Targets with static_configs or dynamic service-discovery;

      1. rule check -> promtool check rules /path/to/example.rules.yml
  5. PromQL

    1. can evaluate: instant vector, range vector, scalar, string
    2. metrics_name{} 可以写为: {__name__="metrics_name"} 比如查询多个 metrics {__name__=~"job:.*"}
    3. subQuery: <instant_query> '[' ':' [] ']' [ @ <float_literal> ] [ offset ] ( is optional. Default is the global evaluation interval.)
    4. Vector matching
    1. ignoring(
    2. on(
  6. Storage

    1. format: https://github.com/prometheus/prometheus/blob/release-2.36/tsdb/docs/format/README.md

GDB

GNU Debugger (GDB) 是 Linux & Unix 上广泛使用的 debugger, 可以对 C, C++, Objective-C, go 等程序 debug.

GDB 可以 1) 对正在运行的程序通过 attach 的方式进行 debug, 2) 也可以通过 gdb 新运行一个程序进行 debug, 3) 还可以直接对 core dump 进行有线的 debug.

GDB 命令 cheatsheet

  1. https://darkdust.net/files/GDB%20Cheat%20Sheet.pdf
  2. https://gist.github.com/rkubik/b96c23bd8ed58333de37f2b8cd052c30

GDB 内部实现

GDB 使用 ptrace 系统调用去观察和控制其它程序的运行. 断点是通过替换原程序的某地址的指令为特殊的指令(int03)来实现的, 执行断点程序产生SIGTRAP中断.
关于 ptrace 特定的操作, 参看: https://man7.org/linux/man-pages/man2/ptrace.2.html